|
Gallery 1 Gallery 2 Gallery 3 Gallery 4 Gallery 5 Colouring methods: page 1 page 2 Image info Download page Request page About the author |
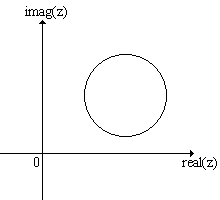
Colouring MethodsBefore I get into the nitty gritty of the contents of this page, I have to first give credit to Damien Jones, whose work with colouring methods inspired me, and who showed me how it could be done. As far as I know, my own methods are generally quite different from his, but I must acknowledge his very considerable input. He has a brilliant fractal gallery Fractalus that you really must visit. (After writing this page, I found he has also done a page in his gallery on his methods - but they are normally quite different from mine, so this page remains) Some knowledge of how fractals are created is assumed in this page. To get you up to speed, I recommend downloading the freeware program Fractint and browsing its help files, or browsing the online documentation. The following is based on the Mandelbrot Set, but most of what is said also applies to Julia Sets. The Mandelbrot Set using the following iteration: z is initialised to 0 (zero), and c is given by the complex 'coordinates' of the point being calculated. The Mandelbrot Set is technically all those values of c for which the orbit (sequence of numbers) given above does not diverge. This property gives just two types of points. The normal way of colouring for the outside is given by the number of iterations before the bailout value is reached. The problem with this is that, by its very nature, the output will give discrete integer colour values, since it is impossible to do 3.45 iterations, for example. Note also that one particular property of the orbit is used - the 'time' until |z| > 2. For many points, hundreds of iterations will be done - this gives hundreds of values of z being generated, none of which are used to give the colour. My new colouring methods attempt to have a look at some new properties of the orbit, giving rise to different colouring patterns. What other properties could be used? In Fractint, you'll find an option on the 'x' screen that is normally set to 'iter'. It can also have the value 'real'. Instead of just returning the number of iterations completed for the point, it adds the value of real(z) at bailout. The other options provide similar types of properties - but only the bailout value of z is used. A simple example of how this could be extended would be an average of all the values of real(z) produced - and this idea can easily be extended further, some function of this average, or an average biased in some way etc. To produce some very different images, the methods I've used have been based often on shapes, or orbit traps. For example, imagine on the z plane, a circle, center (x1,y1), radius a.
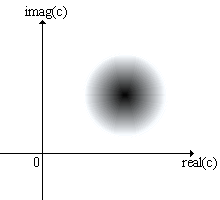
This can be used to trap any value of z which lands within the circle. For example, you could use the last value of z to land within the circle as the basis for colouring. Alternatively, you could use an average of all the valuse of z, or many other possibilities. In my algorithms, I add a value to a running counter each time z lands within the circle. The value added is actually the distance of the point from the edge of the circle, so that points on the edge of the circle have 0 added, those in the centre have the value a added. In the Mandelbrot iteration, z0 = 0, so z1 = c always (in fact this is a common speedup). So, if a circle is defined as above, all those values of c within the circle will give value of z within the circle on the first iteration. So after the first iteration, the colouring, superimposed onto the Argand diagram for c, would look like this:
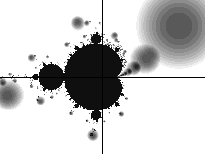
After the first iteration it is a very different matter. As it happens, there are groups of points from all corners of the Mandelbrot Set which 'land' in the circle above, after various numbers of iterations. The picture you eventually build up, bearing in mind that all points actually in the Set are coloured in black, looks a bit like this:
Admittedly, not very thrilling. However, by changing the position and size of the circle, obviously changing the colours used as well, and looking at various place on the image, some surprising results can be obtained. Instead of circles, I often use ellipses - the 'shadows' of the ellipse which appear around the rest of the image are normally distorted to give some interesting shapes. The way these shapes build up produce the images you can see in the Spiral Gallery in particular. I didn't stop at circles and ellipses - I have used parabolas and hyperbolas as well. These are all finite traps - only some values of z are affected by them. I have also used formula that influence all values of z to some extent. For example, the pond ripples effect uses this method, but uses an exponential decay to keep the effect mainly on those points close to the center. Having thought up all these ideas, we can either write our own software to implement them, or we can see what Fractint's formula parser will do for us - continue to the next page on how to implement these ideas in Fractint. |
|


